Setup ESP32 JTAG-Debugging on PlatformIO with a J-Link debug probe
Following the instructions of the PlatformIO documentation (Get started with Arduino and ESP32-DevKitC: debugging and unit testing and J-LINK), I tried to setup my development environment.
Here is how I got it up and running:
- Download and install the J-Link software and documentation pack.
- Download and install the Zadig tool to modify the USB driver of the J-Link (thanks manuelbl).
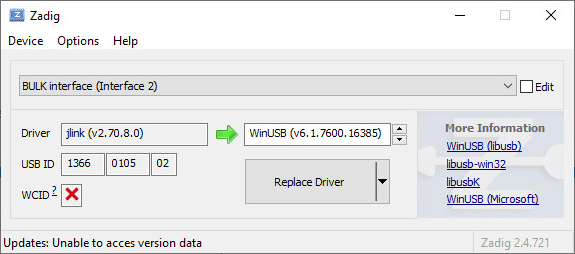
- Run Zadig.exe
- Options > List all devices
- Select BULK interface (Interface 2)
- Change Driver from jlink to WinUSB > Replace Driver
- Setup a new PlatformIO project in VS Code according to the docs.
- Modify the platformio.ini:
 [env:esp32dev]
 platform = espressif32
 board = esp32dev
 framework = arduino
 debug_tool = jlink
 upload_protocol = jlink
The upload_protocol is important, it must be “jlink” not “jlink-jtag” as stated in the docs (thanks lumax).
- Start debugging by pressing F5 and have fun debugging your Arduino ESP32 project via JTAG.
Troubleshooting
LIBUSB_ERROR_NOT_FOUND
Replace the jlink USB-Driver with WinUSB (see step 2 above).
“Error: JTAG scan chain interrogation failed: …”
Double check your wiring, seriously!!!
It should be like this:
| J-Link | ESP32 | Description |
|---|---|---|
| 1 | VCC (3v3) | |
| 4 | GND | |
| 5 | TDI (D12) | Test Data In |
| 7 | TMS (D14) | Test Mode State |
| 9 | TCK (D13) | JTAG Return Test Clock |
| 13 | TDO (D15) | Test Data Out |
| 15 | RESET (EN) | (active low) reset input of the target |
F5 -> Could not find the specified task.
If you go to the Debug view, there is a green arrow at the top left of the window, labelled RUN AND DEBUG. Next to it, there is a combo box. The combo box should say PIO Debug (your project name).
Thanks manuelbl!